INTRODUCTION
The stars that we can observe in the night sky have not been there forever. They were formed one day from gigantic clouds of gas and dust. That happened with our own Sun and with all the stars of the Universe. In fact, our galaxy, the Milky Way, keeps forming stars at the moment, in a dynamical process dominated by gravity, which brings everything together. There are still many unknowns in this process of star formation. In particular, little is known about the formation of massive stars, those that have several times the mass of our Sun, which is of rather small size in comparison.
One of the main facts hampering the study of massive star formation by astronomers is that they form incredibly fast, in only a few million years, which is barely an instant in the universal timescale. Because of this, we know very few stars undergoing massive star formation, with the corresponding complications for studying their main characteristics and shed some light on the still unknown physical process that led to their colossal sizes. Another matter of issue is that it seems that these massive objects form in clusters, I.e., in the company of other young stars that are born at the same time in its vicinity. Although there are solid pieces of evidence supporting this idea, no solid proof has yet been presented.
Luckily, the astronomical community is currently undergoing a data revolution. After two years of observations, the European Space Agency (ESA) spacecraft Gaia has measured distances to more than a billion stars and other celestial bodies. Although this may seem of little importance to the outsider, the truth is that the distance to astronomical objects is of capital importance for the astronomical community and, despite that, it is a parameter very difficult to obtain in the extremely large dimensions of space, where there are no references that can ease its measurement.
In this interactive tutorial, you will be guided through the process of identify young objects in a cluster and learn more about their properties in a very similar way to what is done by professional astronomers all over the world. By identifying these clusters around massive stars, we can step forward in the knowledge of their formation scenario.
WHAT DO WE SEE?
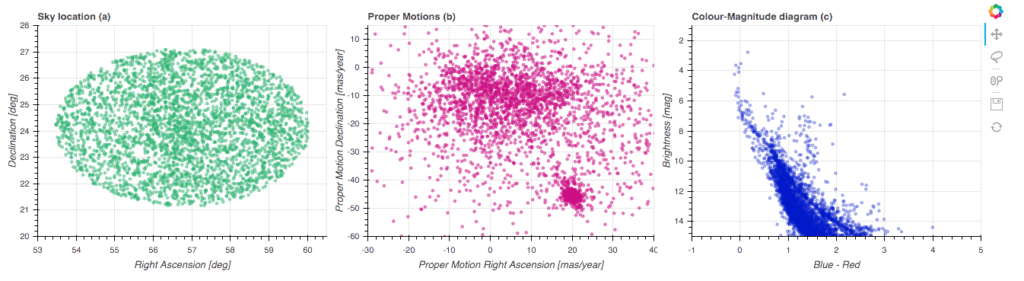
To study a group of young stars, astronomers use different techniques, theoretical (like models) or observational (like obtaining images from telescopes) but all those can be interpreted in simple graphs like the figure below.
Click on the following link to view the interactive image.
The above shows the different properties for a known open cluster (Can you guess which clusters it is?) in diverse plots for the same group of young stars.
The panel on the left, Sky location (a), shows the position of the stars in the sky. But what does this mean? Each stars, just as the places in your town, have two coordinates that establish their position on the sky (their position on a map). These coordinates are know as right ascension (RA or α) and declination (DEC or δ) which are comparable with the longitude and latitude in Earth, respectively. The right ascension is traditional measured in hours, minutes and seconds and the declination is measured in degree, minutes and seconds. In this particular case, the RA and DEC are shows in degrees, this could be make with simple transformations. The RA and DEC values are independent from how the star is observed and the movement of the Earth, they can be used in star maps and catalogues; which are use by astronomers to know the position of the known stars or group of stars, like Vega and Orion Nebula, respectively.
The middle panel, Proper Motion (b), shows the apparent movement of the stars. This movement changes year after year and is produce by the velocity of the star across the line of sight. This means that the proper motion is the projection onto the celestial sphere of the motion of a star relative to the Solar System which is usually measured in star catalogues as the change in right ascension (pmra or μα) and declination (pmdec or μδ) per year or century. These values can be estimated because the stars are considered to be formed from the same cloud and it can be assumed that the stars are at the same distance from the Sun and share kinematic properties.
Finally, the panel on the right, Colour-Magnitude diagram (c), shows a relation between the brightness and the colour index of the stars which are obtained directly from observations and are equivalent to luminosity and effective temperature of the stars, respectively. It is also known as the Hertzsprung–Russell diagram (or HR diagram), named after its creators Ejnar Hertzsprung and Henry Norr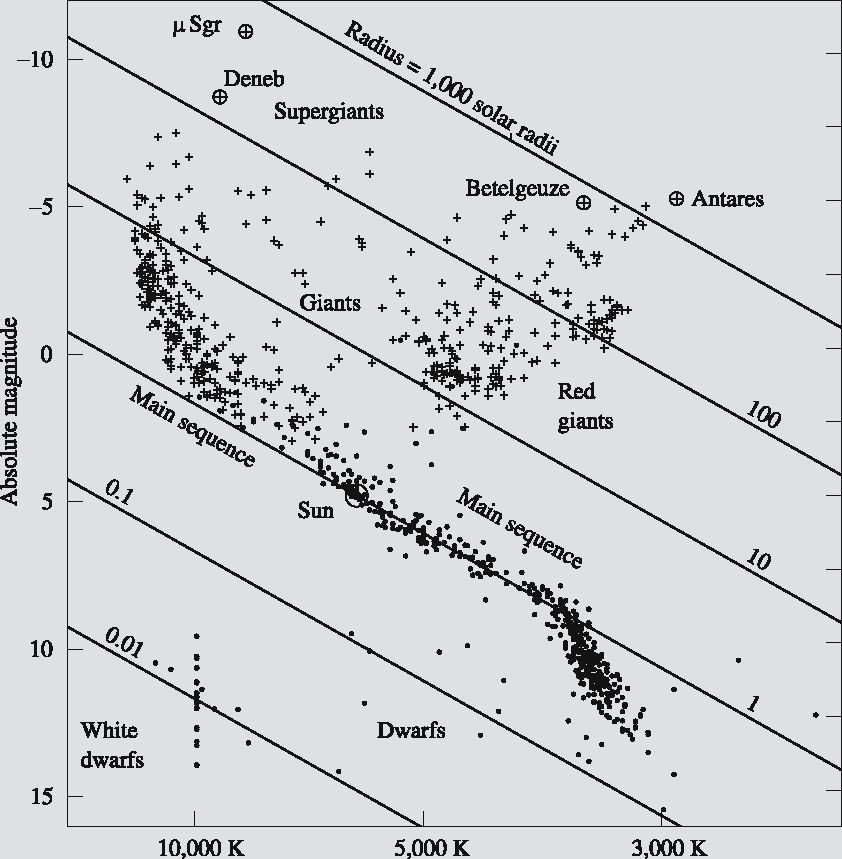 is Russell who studied the relation between the absolute magnitudes and the spectral types of stars. This diagram, as shown in the following figure, is divided into different areas that show a particular stage of the evolution of the stars. For example, most of the stars are located along a roughly diagonal curve called the main sequence, where between 80% and 90% of all the stars are located in the area. The Sun is situated around the middle of the main sequence.
The HR diagram is an excellent tool to study stars that appear to be in clusters because they will have a common origin and it is possible to adopt general properties for the cluster member, like proper motions, age or distance. A cluster, as mentioned before, is nothing more a set of stars that are held together by the effect of gravitation. In this sense, two types of clusters can be distinguished: 1) Open Clusters, formed by relatively young stars located in the galactic disk and usually are comprised of 50 to several hundred stars loosely and amorphously distributed but moving with a common velocity through the surrounding field of stars and 2) Globular Clusters, formed by relatively old stars, contain several hundred thousand stars, and have a striking spherical (globular) appearance, to the point that in many cases it is impossible to distinguish individual stars.
After this explanation, can you distinguish what type of cluster is show in the Colour-Magnitude diagram (c) interactive plot? Or, have you notice in the Proper Motion (b) plot two different groups of stars? Play with the plot and draw your conclusions!!!
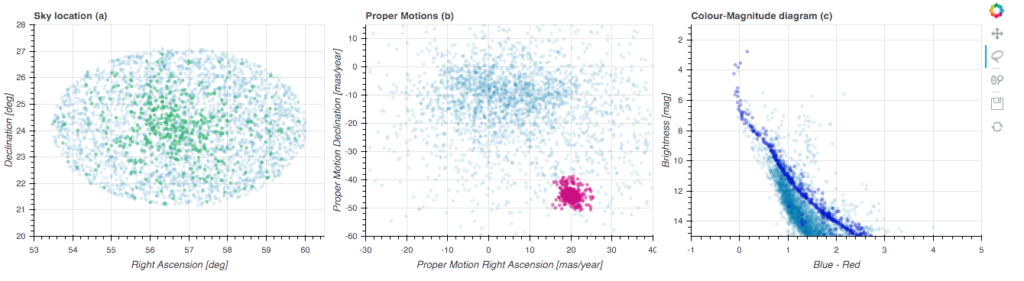
If your instincts make you to select the small group in the Proper Motion (b) figure, you instantly are selecting the open cluster in the data, also you can see how the main sequence stars have been highlighted in the Colour-Magnitude diagram (c) and at the same time the location of these stars are is shown in the Sky location (a).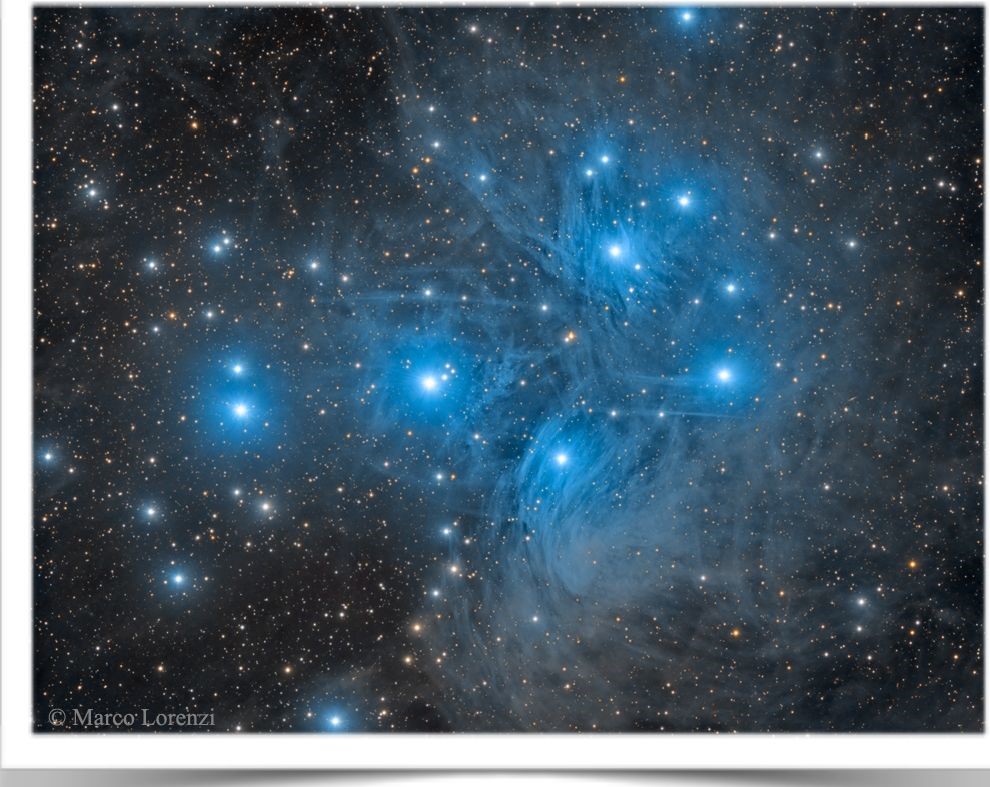
The stars that form part of an open cluster that you are seeing in these plots are from the Pleiades, which is perhaps the most famous star cluster in the sky. The bright stars of the Pleiades can be seen without binoculars from even the depths of a light-polluted city. Also known as the Seven Sisters and M45, the Pleiades lies about 400 light years away toward the constellation of the Bull (Taurus).
This same procedure can be done for similar groups of stars from which the astronomers draw the same graphics describe before to characterize star formation regions in the sky.
How does the interactive plot work?
On the right side of the figure you will find some icons that will help you with the plot.